One of a developer’s most dreaded moments is always when a code is run, with high expectations of everything running smoothly and suddenly, we start seeing lines of code and information, we didn’t write, in our terminal, with reference to our program telling us we did something wrong.
These lines of information, known as a Traceback, are annoying and even most times scary for beginner developers.
Funny enough, depending on how you approach it, it can be easy to Trace Back the issue, or where the problem started from.
Different programming languages display tracebacks differently. In Python, the main error message appears at the bottom, preceded by the call chain that led to it. In JavaScript, it’s the opposite: the error message and the exact line that broke appear at the top, with the rest of the call stack listed below it.
Most, if not all tracebacks follow the same pattern, which is the file where the error happened, the line where it happened and the function that caused the error, just those three and repeat.
Why the tracebacks often looks overwhelming is because the errors are chained together, an error in a place causes an error in another place and it keeps chaining from the beginning of the error, to the end of the error
This is a simple python program
def divide(a, b):
    return a / b

def calculate(a, b):
    return divide(a, b)

def main():
    calculate(10, 0)

if __name__ == "__main__":
    main()
that if run, generates this traceback error
Traceback (most recent call last):
  File "app.py", line 12, in <module>
    main()
  File "app.py", line 9, in main
    calculate(10, 0)
  File "app.py", line 5, in calculate
    return divide(a, b)
  File "app.py", line 2, in divide
    return a / b
ZeroDivisionError: division by zero
The first and the last line tells the user two things, Traceback (most recent call last): tells the user, an error has occurred and they should review it, the last line ZeroDivisionError: division by zero, tells the error which has happened, which in this case, occurred because we tried to divide by zero, which is an abnormality in maths
The rest of the lines, are just the same patterns repeated, and separating them we have
File "app.py", line 12, in <module>:main()File "app.py", line 9, in main:calculate(10, 0)File "app.py", line 5, in calculate:return divide(a, b)File "app.py", line 2, in divide:return a / b
We could read this from the top or from the bottom but it is often best to start from the where the error is to save time, that is, if the traceback is written from top to bottom, we read from bottom and vice versa, as in the case of languages like JavaScript, where the actual error message sits right at the top.
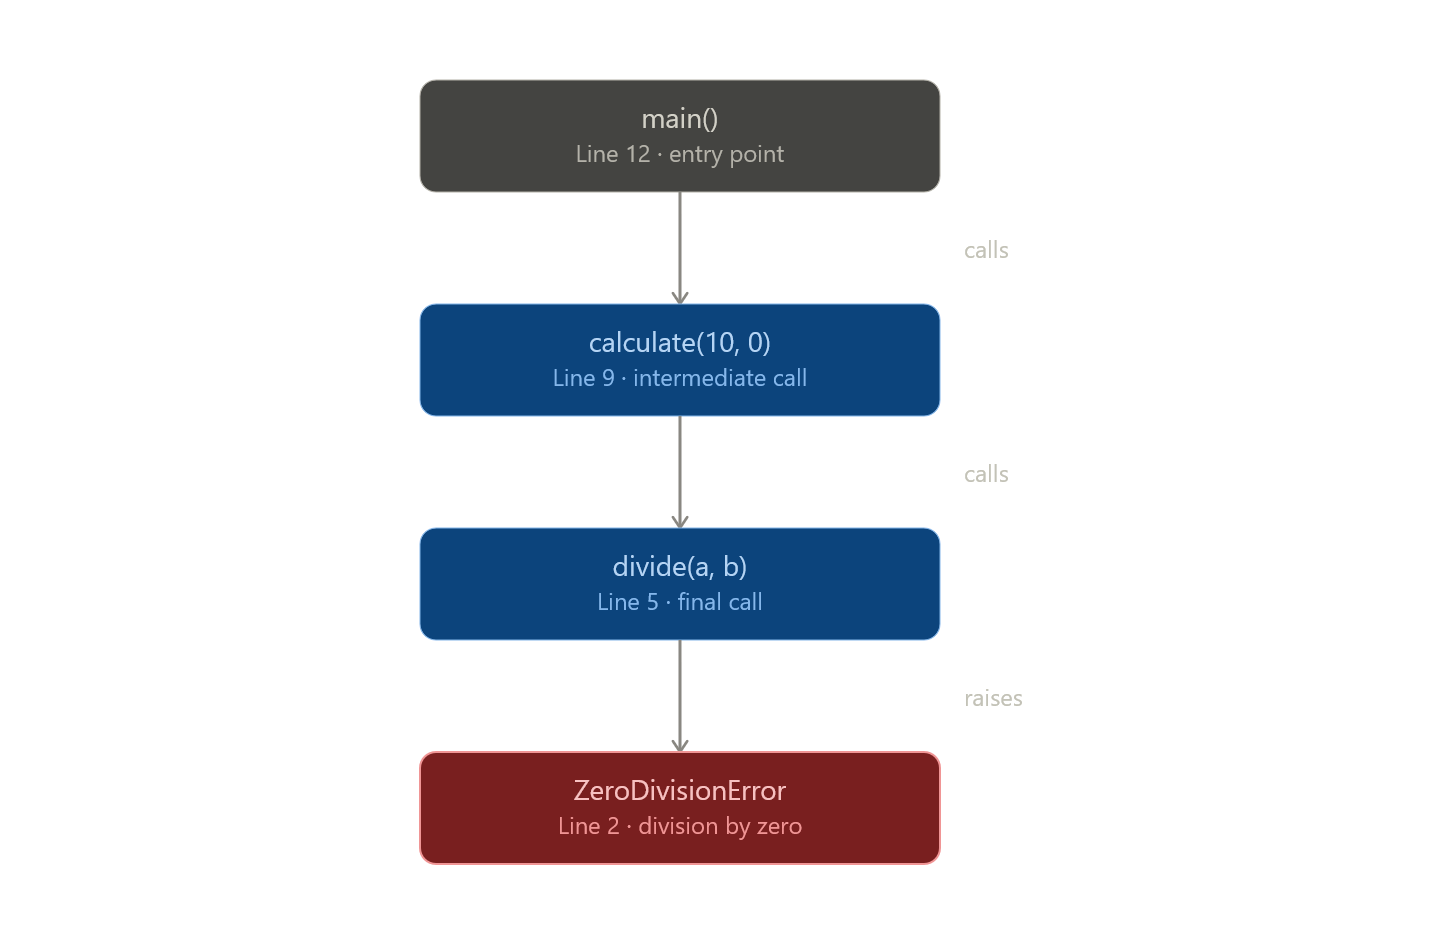
Reading from the bottom, this simply says, the error happened in the file app.py, line 2, when we tried to return a/b in the divide function. We would know that divide is a function, because in the earlier line, divide was written like this, divide(a,b), which is a function in python.
Moving up to the next frame, File “app.py”, line 5, in calculate, we can see that divide(a, b) was called inside the calculate function, which passed the arguments along and brought the bad value (0) one step closer to the crash.
Going up again to File “app.py”, line 9, in main, we find calculate(10, 0) being called inside the main function, which is the exact moment the 0 was passed into the function chain.
Finally, at the very top frame, File “app.py”, line 12, in <module>, this shows where the error started, which was when we ran main().
By following these backwards, starting from the actual error at line 2, then checking line 5, line 9, and line 12, we can trace the entire journey of the code and pinpoint exactly where things went wrong.
Now, in most codes though, the tracebacks are more than often, larger than 4 lines, and in some cases, the tracebacks contains the internal packages of the languages. For example, this code below
import json

# Sets are not JSON-serializable by default
json.dumps({1, 2, 3})
is expected to give a traceback because sets are not JSON serializable, which leads to the error below.
Traceback (most recent call last):
  File "test.py", line 4, in <module>
    json.dumps({1, 2, 3})
  File "C:\Python311\Lib\json\__init__.py", line 231, in dumps
    return _default_encoder.encode(obj)
  File "C:\Python311\Lib\json\encoder.py", line 199, in encode
    chunks = self.iterencode(o, _one_shot=True)
  File "C:\Python311\Lib\json\encoder.py", line 257, in iterencode
    return _iterencode(o, 0)
  File "C:\Python311\Lib\json\encoder.py", line 179, in default
    raise TypeError(f'Object of type {o.__class__.__name__} '
TypeError: Object of type set is not JSON serializable
First of all, we know what the error is from the last line, which says TypeError: Object of type set is not JSON serializable, however, reading this would get confusing as we are seeing files that we didn’t write.
The two lines above literally looks like this
File "C:\Python311\Lib\json\encoder.py", line 179, in default
    raise TypeError(f'Object of type {o.__class__.__name__} '
and looking at the file path, we don’t remember creating files like that, those files are often internal packages for the program language and for a language for python, would contain the ‘python + version\lib’, in the file path, so for the two lines above, the language is python with the version 3.11, then \lib
When encountering file paths like that, you would skip over that, till you get to a file you know that you created, so going up and skipping all the ‘python + version\lib’, we would arrive this line
File "test.py", line 4, in <module>
    json.dumps({1, 2, 3})
which is the line and file which is where the error occurred.
Also note that the our file might not always appear above all the ‘python + version\lib’ file paths and sometimes might be in the middle of all those lines. For example, this code below
import threading

def break_me():
    return 1 / 0

t = threading.Thread(target=break_me)
t.start()
t.join()
return the same division by zero error but in a more complex way
The traceback, however, would look like this
Exception in thread Thread-1 (break_me):
Traceback (most recent call last):
  File "C:\Python311\Lib\threading.py", line 1038, in _bootstrap_inner
    self.run()
  File "C:\Python311\Lib\threading.py", line 975, in run
    self._target(*self._args, **self._kwargs)
  File "test.py", line 4, in break_me
    return 1 / 0
ZeroDivisionError: division by zero
Looking at the traceback, apart from the getting the error at the last line, our file which got the error is also immediately above too.
Tracebacks, is just filtering the noise of codes on your terminal to find the exact line that caused the error. The red lines or colours might get scary but it’s funny enough it was actually added to differentiate different lines.
And while errors could be red, they could also be other colours.
And most languages follow the same structure if not similar structure, JavaScript, as mentioned earlier, Just puts the error at the top, we would still have to sort out the lines of code.
Other languages like Go or Rust, might use the word Panic instead of Exception or Error